Odoo and PostgreSQL Performance Tuning Guide
Learn how to optimize your Odoo server and PostgreSQL database for faster performance, lower latency, and better scalability in this complete tuning guide.

Introduction
You’ve got Odoo running on your server and now it’s time to squeeze out every drop of performance. This guide shows you how to fine-tune both Odoo and PostgreSQL so that Odoo runs faster, handles more users, and stays smooth even when things get busy, whether you manage the server yourself or through Cloudpepper.
This guide is tuned for self-hosted Odoo 16-19 on Linux with PostgreSQL 14-18. The same principles apply to nearby versions, but defaults do move between Odoo and PostgreSQL releases, so always compare the recommendations with your actual odoo-bin --help and SHOW values before changing a production server.
Before you start
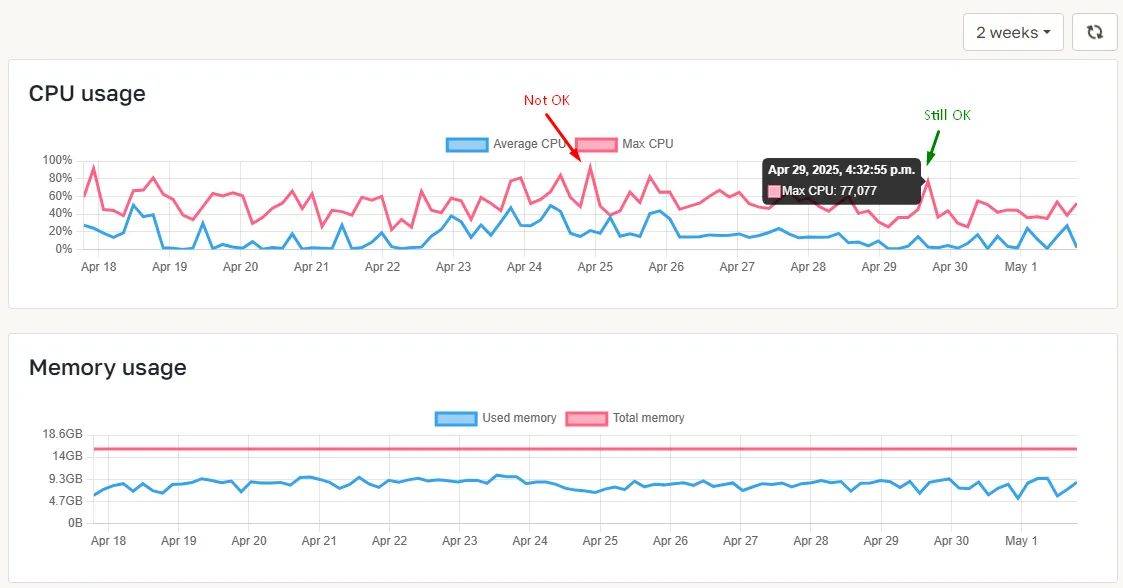
Keep your server’s CPU and RAM usage below 80%.
When tuning Odoo and PostgreSQL, monitor resource usage closely. Brief spikes over 80% are usually harmless if recovery is quick, but consistently staying below this level reduces the risk of bottlenecks and helps your Odoo instances run smoothly.
With Cloudpepper, you can track CPU and RAM usage in the Monitoring tab of your server dashboard. For example, the server below showed occasional spikes towards 100%. Reducing the number of workers immediately stabilized usage back under 80%.
Step 1. Choose the right number of workers
What is an Odoo worker?
An Odoo instance spawns several types of workers – dedicated processes that each load the full Python environment and handle different tasks:
- HTTP workers (
workers): handles the bulk of user activity, such as loading pages, creating invoices, or processing sales. - Cron workers (
max_cron_threads): executes scheduled background jobs like reminders, auto-confirmations, or data updates. - Gevent / long-polling worker (
gevent_port): manages real-time features such as chat, bus notifications, and WebSocket traffic. Older Odoo guides often call this the long-polling worker; newer Odoo versions use the gevent terminology.
Think of workers like cashiers. Too few and queues build up; too many and they sit idle wasting resources.
For performance tuning, the focus is almost always on HTTP workers (we’ll just call these “workers”), since they drive user interactions. Cron and gevent/long-polling workers usually stay at one each. Only consider increasing the cron workers (max_cron_threads) to 2 or 3 if you have many background tasks running in parallel.
How many workers do I need?
As a general rule of thumb, 1 worker can support ~6 concurrent users or ~5,000 website visitors per day. However, actual capacity per worker varies widely with usage patterns. For example, one Odoo deployment might handle 50–100 users on a single worker if they perform light operations, whereas another with heavy transactions might see one worker struggle with 20 users.
Example case: “How many workers do I need for 20 Odoo users?”
If most users are idle and only a few work at the same time, 1 worker is enough and setting workers to 2 gives you some buffer for spikes. However, if all 20 users are all working concurrently (actively clicking, saving, or loading screens at the same moment), your Odoo instance will need 3 to 4 workers (20 active users / 6 concurrent users per worker = 3.33 workers).
Minimum of 2 workers required for PDF generation
If your math suggests just 1 worker, Odoo requires at least 2 to generate PDF reports: one to process request and another to serve static assets (CSS, images). With only 1 worker, the request will block itself, and the report will fail.
What about zero workers?
When you set your workers = 0, Odoo runs in threaded mode. This is fine for development, demos, or very light loads where you want to minimize memory usage. There is no threads setting to add in odoo.conf; the threaded server can run concurrent requests inside the same process, so PDF generation can still work for light use.
However, for production environments, multiprocess mode (workers > 0) is strongly recommended. It offers better CPU utilization, crash isolation, and enables Odoo’s built-in worker recycling for long-running or memory-heavy processes.
Where to set Odoo workers?
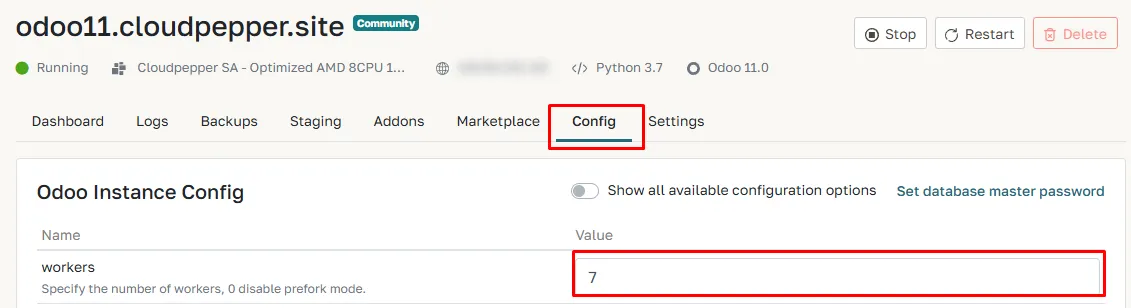
You can set the workers parameter in the odoo.conf configuration file of your Odoo instance. You will need to restart the Odoo service for the changes to take effect.
On Cloudpepper, go to the Config tab of your instance and click Save. Your Odoo instance will automatically restart with the new configuration.
How many workers can my CPU handle?
If you size by hardware rather than user counts, start from your CPU core count. A common upper-limit guideline is:
Total workers (HTTP + cron) = CPU cores × 2 + 1This includes all HTTP and cron workers across all Odoo instances on the server. The gevent/long-polling worker isn’t part of this formula since it barely uses CPU, but it does load the full Odoo environment, so make sure to budget memory (RAM) for it as an extra process.
Example: on a 4-core server
4 cores × 2 + 1 = 9 total workers (HTTP workers + cron workers)Understanding the cron worker
The formula takes into account the workers Odoo uses for background tasks.
This worker is configured separately using the “max_cron_threads” parameter. In the example above with 9 total workers, your Odoo config could for example look like this:
workers = 8max_cron_threads = 1or if you run background tasks simultaneously it can be split like this:
workers = 7max_cron_threads = 2Keep in mind: every worker uses RAM
Each Odoo worker loads the full environment and keeps using memory (RAM) even when idle. Tasks like report generation or background jobs can push memory usage much higher.
Typical RAM usage per worker:
- Idle: ~80–200 MB (sometimes more)
- Light usage: ~200-300 MB
- Average usage: ~300-500 MB (budget 400+ MB on Odoo 17-19 or custom-heavy databases)
- Heavy usage (large reports, etc.): 1GB or more
Example: 2-core server with 4 GB RAM
Using the CPU-based rule:
2 × 2 + 1 = 4 HTTP workers + 1 cron worker+ 1 gevent/long-polling worker= 6 total workers6 workers × ~400 MB = ~2.4 GB total RAMThat’s about 60% of the server’s 4GB memory used just by Odoo workers, not counting PostgreSQL, the OS, and other services. On small servers, RAM usually becomes the limit before CPU does.
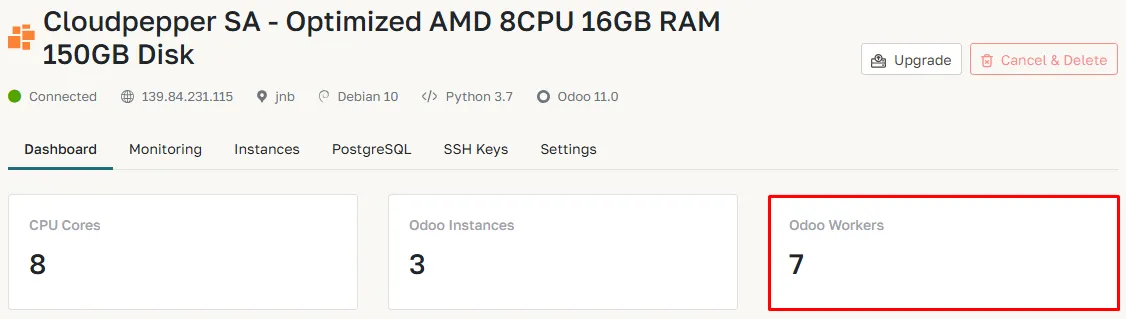
How many Odoo workers in total are active on my server?
If you’re using Cloudpepper, you can view the total number of active Odoo workers across all your instances directly on the Dashboard of your server.
Optimizing worker count for heavy loads (less is more)
When running intensive tasks like large data imports or big reports, Odoo and PostgreSQL compete heavily for CPU. In these cases, it’s best to start conservatively:
Odoo HTTP Workers = number of CPU coresThis approach ensures:
- Each worker has enough CPU time
- Less CPU context-switching overhead
- PostgreSQL keeps the resources it needs
Scaling up safely
If the system feels sluggish or cron jobs start queuing, and your server’s CPU usage stays under 70 percent with enough free RAM, you can add another worker. This lets you increase performance from a stable baseline without risking system stability.
Recommended worker setup summary
These are different starting points, not rules to stack on top of each other. Pick the one that matches what you know best: active users, hardware, or a hard upper limit.
Based on users:
workers = ceiling(active concurrent users ÷ 6)max_cron_threads = 1Based on CPU (recommended start and in case of heavy load):
workers = number of CPU cores (minimum 2)max_cron_threads = 1Based on CPU (upper limit rule)
workers = 2x number of CPU cores (minimum 2)max_cron_threads = 1Important Odoo settings beyond workers
Before jumping into PostgreSQL tuning, let’s cover a few more essential Odoo settings that can affect performance, stability, and resource usage.
| Parameter | Default value | Recommended setting | Explanation & tips |
|---|---|---|---|
max_cron_threads | 2 (Odoo 16+) | 1 for most instances; 2 to 3 only if you have many concurrent or long-running cron jobs | Defines how many cron jobs can run simultaneously. In multiprocess mode, cron workers are extra processes, so budget CPU and RAM for them or reduce HTTP workers accordingly. |
gevent_port | 8072 | Keep the default unless the port conflicts; route /websocket/ traffic to it in your reverse proxy when workers > 0 | Required for real-time chat, bus notifications, and WebSocket traffic in multiprocess deployments. |
limit_request | 65536 (2**16, Odoo 16+ source default) | Keep the default unless you are chasing a confirmed worker memory leak | Recycles workers after a number of requests. Pair it with limit_memory_soft so long-lived workers do not grow forever. Older guides sometimes cite 8192 — that value is no longer the source default. |
limit_time_cpu | 60 s | Keep 60 s for normal web requests; raise only for legitimate imports, reports, or cron jobs after checking why they are slow | Maximum CPU time a worker may spend on one request or cron job. If exceeded, Odoo kills the worker to protect the server. |
limit_time_real | 120 s | Roughly 2 x limit_time_cpu | Maximum wall-clock time, including DB waits and external calls. Keeps slow requests from tying up workers indefinitely. |
limit_memory_soft | 2048 MB | 2048 MB for most cases; lower it on small RAM servers | Soft worker memory cap. Keep all workers (HTTP + cron + gevent/long-polling) x limit_memory_soft below physical RAM, preferably below 70-80% so PostgreSQL and the OS have room. |
limit_memory_hard | 2560 MB | Slightly above limit_memory_soft, e.g. 2560 MB | Hard memory ceiling. When hit, the worker is killed immediately as a last-resort safety net. |
db_maxconn | 64 | 16-32 for many single-instance deployments; keep 64 only when monitoring shows the pool is genuinely needed | Controls how many physical PostgreSQL connections each Odoo process may hold. Too low causes pool waits; too high can exhaust PostgreSQL memory and connection slots. |
db_maxconn_gevent (Odoo 17+) | Unset (falls back to db_maxconn) | Set separately only if the gevent worker needs a different connection ceiling | Useful when WebSocket/bus traffic should not share the same DB pool assumptions as HTTP workers. |
Step 2. Tuning PostgreSQL for Odoo
2.1 Parameter recommendations
These recommendations assume PostgreSQL and Odoo are running on the same server. If PostgreSQL is managed elsewhere, use the equivalent parameter group or managed-database setting and leave extra headroom for network latency.
2.1.1 Memory for caching & sorts
PostgreSQL ships with defaults for tiny 1 GB servers. For Odoo, those defaults are far too conservative. By adjusting four key memory parameters, you can unlock significant performance gains.
| Parameter | What it controls | Recommended values |
|---|---|---|
shared_buffers | DB page cache | 15-20% of total RAM. On a dedicated PostgreSQL server with large RAM, test 25-40% instead of assuming bigger is always faster. |
effective_cache_size | Planner hint for PostgreSQL + OS cache | 50-70% of RAM excluding Odoo, roughly 2-3x shared_buffers. |
work_mem | RAM per sort/hash operation | 8 MB on a 4 GB box, 16 MB on an 8 GB box, 32 MB on a 16 GB+ box. Increase only for measured reporting queries because each connection, operation, and parallel worker can allocate it separately. |
maintenance_work_mem | VACUUM and index builds | Small/medium servers: around 1/16 of RAM. Large servers: cap normal settings around 1-2 GB unless you are doing planned index maintenance. If autovacuum_work_mem = -1, every autovacuum worker can use up to this value. |
2.1.2 WAL & checkpoint smoothing
Fewer, smoother checkpoints reduce stalls.
| Parameter | Why it matters | Recommended value |
|---|---|---|
checkpoint_completion_target | Spreads writes to avoid I/O spikes | 0.9. This is already the PostgreSQL default since PG 14, so you can omit it on modern installs if it has not been changed. |
checkpoint_timeout | Lowers checkpoint frequency and I/O spikes | 15-30min. The default of 5min is usually too short for write-heavy Odoo workloads. |
min_wal_size / max_wal_size | How much WAL can build up before forcing checkpoints | 1 GB / 2 GB for small Odoo instances, 2 GB / 4-8 GB for larger instances. If disk space and recovery objectives allow it, use 5-12 GB max_wal_size on busy servers to reduce checkpoint pressure. |
Fewer checkpoints = fewer fsync storms and faster commits under load.
2.1.3 Connections, parallelism & SSD tweaks
Keep max_connections sane, align worker pools with cores, and use SSD-friendly planner hints.
| Parameter | Why it matters | Recommended value |
|---|---|---|
max_connections | Every PostgreSQL backend consumes RAM and scheduler overhead | Start with 50-100 for direct Odoo-to-PostgreSQL deployments and monitor. For larger multi-instance servers, 100-200 is reasonable. With PgBouncer, size this to the pool’s server-side connections plus admin/maintenance headroom, not to Odoo’s theoretical client count. |
max_worker_processes | Background process ceiling for parallel query and maintenance | Usually around CPU cores, and always at least max_parallel_workers. |
max_parallel_workers | Cluster-wide pool for parallel operations | Usually around CPU cores, but do not raise it without CPU headroom. Always keep max_parallel_workers <= max_worker_processes. |
max_parallel_workers_per_gather | Parallel workers one query may request | 1-2 for normal Odoo OLTP workloads. Keep PostgreSQL’s default of 2 if unsure; use 1 on busy small servers. Raise only for measured large reporting or BI queries where EXPLAIN ANALYZE proves parallelism helps. |
random_page_cost | Planner hint for SSD/NVMe random reads | 1.1 on SSD/NVMe. |
effective_io_concurrency | Allows more concurrent disk I/O on systems that support it | 64 for SATA SSD, up to 200 for NVMe. |
jit | JIT can help big analytical queries but adds overhead to many small queries | off for most Odoo systems. Enable only for reporting sessions after measuring. |
2.1.4 Autovacuum keeps you fast
Autovacuum prevents table bloat. Defaults are fine for small systems, but large Odoo tables can accumulate millions of dead rows before the default 20% vacuum threshold triggers.
| Parameter | Why it matters | Recommended value |
|---|---|---|
autovacuum_vacuum_scale_factor | Controls how much a table must change before VACUUM runs | Lower to 0.05 for large/high-churn tables; use 0.02 for extreme churn tables such as mail_message, POS, logs, or custom queue tables. Prefer per-table settings over lowering the whole cluster too aggressively. |
autovacuum_analyze_scale_factor | Determines how often planner statistics refresh | Match the vacuum scale factor: 0.05 for large tables, 0.02 for extreme churn. |
autovacuum_max_workers | Max number of autovacuum workers | Keep 3 on small servers; raise to 5 on larger systems with spare CPU and I/O. |
autovacuum_vacuum_cost_limit | How much work autovacuum can do before pausing | Increase from default 200 to 1000 on large NVMe servers when vacuum falls behind. |
autovacuum_vacuum_cost_delay | Pause time after the cost limit is reached | Keep the modern default 2ms in most cases. Raising it to 5ms slows vacuum down unless you also compensate heavily with cost limits. |
autovacuum_work_mem | Memory cap per autovacuum worker | Leave default on small systems. On large servers, set 512 MB-1 GB if maintenance_work_mem is high and you want predictable autovacuum memory use. |
For very large hot tables, make the recommendation concrete with per-table storage parameters:
ALTER TABLE mail_message SET ( autovacuum_vacuum_scale_factor = 0.02, autovacuum_analyze_scale_factor = 0.02);Use the same pattern only after checking table size, dead tuples, and write rate. Do not blindly apply it to every table.
2.1.5 Slow query visibility
Do not tune PostgreSQL blind. Enable slow query logging and pg_stat_statements so you can see which Odoo queries actually cost time.
log_min_duration_statement = 500mstrack_io_timing = on
# If shared_preload_libraries already has values, append pg_stat_statements.shared_preload_libraries = 'pg_stat_statements'compute_query_id = onpg_stat_statements.max = 10000pg_stat_statements.track = all
Then enable the extension in each Odoo database you want to inspect:
CREATE EXTENSION IF NOT EXISTS pg_stat_statements;
SELECT query, calls, total_exec_time, mean_exec_time, rowsFROM pg_stat_statementsORDER BY total_exec_time DESCLIMIT 20;
For databases over 50 GB, profile the usual hot tables first: account_move_line, mail_message, mail_tracking_value, ir_attachment, pos_order_line, and any large custom tables. Add composite or partial indexes only when EXPLAIN (ANALYZE, BUFFERS) proves they remove scans, sorts, or expensive joins. Extra indexes slow writes and add autovacuum work.
2.1.6 PgBouncer for connection control
PgBouncer is useful when many Odoo workers or instances create more client connections than PostgreSQL should keep open. It is connection control, not a magic query-speed switch.
For normal HTTP and cron traffic, transaction pooling is usually the mode that reduces real PostgreSQL connections. Be careful with gevent/long-polling traffic: Odoo bus features can depend on PostgreSQL session state such as LISTEN/NOTIFY, while transaction pooling deliberately does not preserve session state between transactions. Route that traffic directly to PostgreSQL or through a separate session pool if your setup needs it.
Keep pools scoped per database or Odoo instance, set db_maxconn so Odoo cannot flood PgBouncer with useless client connections, and size PostgreSQL max_connections for PgBouncer’s server-side pool plus maintenance/admin headroom. In transaction pooling, do not rely on server_reset_query; PgBouncer does not use it by default in that mode.
2.1.7 Filestore and attachments
Keep binary attachments out of PostgreSQL. Odoo should store large ir_attachment files in the filestore or an external object-storage backend, not in database rows. Database-stored attachments increase backup size, cache churn, vacuum work, and query latency for no benefit.
On busy systems, place the filestore on fast storage, monitor disk latency, and consider object storage when attachments dominate disk growth. If large downloads are common, use Odoo’s x_sendfile support with Nginx X-Accel where available so the web server handles file transfer instead of tying up Odoo workers.
2.2 Sample PostgreSQL configs
2.2.1 Small – 2 vCPU / 4 GB RAM (NVMe SSD)
shared_buffers = 768MBeffective_cache_size = 2.0GBwork_mem = 8MBmaintenance_work_mem = 256MB
checkpoint_timeout = 15mincheckpoint_completion_target = 0.9min_wal_size = 1GBmax_wal_size = 2GB
max_connections = 50max_worker_processes = 2max_parallel_workers = 2max_parallel_workers_per_gather = 1
random_page_cost = 1.1effective_io_concurrency = 200jit = offlog_min_duration_statement = 500ms
2.2.2 Medium – 4 vCPU / 8 GB RAM (NVMe SSD)
shared_buffers = 1.5GBeffective_cache_size = 5GBwork_mem = 16MBmaintenance_work_mem = 512MB
checkpoint_timeout = 20mincheckpoint_completion_target = 0.9min_wal_size = 1GBmax_wal_size = 4GB
max_connections = 100max_worker_processes = 4max_parallel_workers = 4max_parallel_workers_per_gather = 2
random_page_cost = 1.1effective_io_concurrency = 200jit = offlog_min_duration_statement = 500ms
2.2.3 Large – 8 vCPU / 16 GB RAM (NVMe SSD)
shared_buffers = 3GBeffective_cache_size = 10GBwork_mem = 32MBmaintenance_work_mem = 1GB
checkpoint_timeout = 30mincheckpoint_completion_target = 0.9min_wal_size = 2GBmax_wal_size = 8GB
max_connections = 100max_worker_processes = 8max_parallel_workers = 8max_parallel_workers_per_gather = 2
random_page_cost = 1.1effective_io_concurrency = 200jit = offhuge_pages = trylog_min_duration_statement = 500ms
2.2.4 Extra Large – 16 Dedicated CPU Cores / 128 GB RAM (NVMe SSD)
shared_buffers = 32GB             # ~25% of RAM; test 16–32GBeffective_cache_size = 96GB       # ~3x shared_bufferswork_mem = 32MB                   # 64MB for reporting sessionsmaintenance_work_mem = 2GB
checkpoint_timeout = 30mincheckpoint_completion_target = 0.9min_wal_size = 2GBmax_wal_size = 12GB
max_connections = 200max_worker_processes = 16max_parallel_workers = 16max_parallel_workers_per_gather = 2
random_page_cost = 1.1effective_io_concurrency = 200jit = offhuge_pages = trylog_min_duration_statement = 500ms
autovacuum_max_workers = 5autovacuum_work_mem = 1GBautovacuum_vacuum_scale_factor = 0.05   # 0.02 on extreme churn tablesautovacuum_analyze_scale_factor = 0.05autovacuum_vacuum_cost_limit = 1000autovacuum_vacuum_cost_delay = 2ms